
One platform, from source database to published Dashboard
Each layer builds on the one before it, so the numbers in every Dashboard come from the same definitions.
Connect the databases you already have
Add connections to SQL Server, Azure SQL, PostgreSQL, MySQL/MariaDB and Oracle. Test a connection before you save it. Passwords are encrypted at rest and never displayed again. No database? Upload a CSV file and it becomes a Data View.
Data Views: curated queries, stored and refreshed
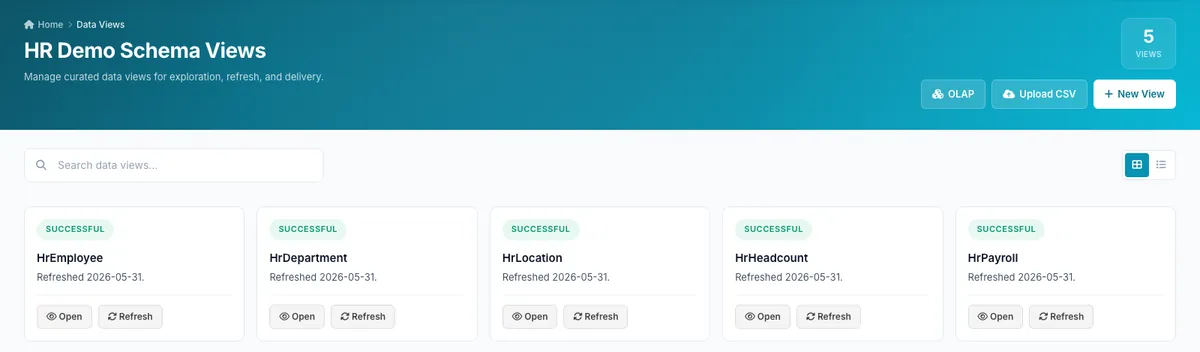
A Data View is a named SQL query over a Data Source. dots validates and previews it, then stores a copy of the result. Refresh whenever you need to and see when each view last refreshed. Browse, filter and search any view, and export it to Excel or CSV.
Semantic Models: define your metrics once
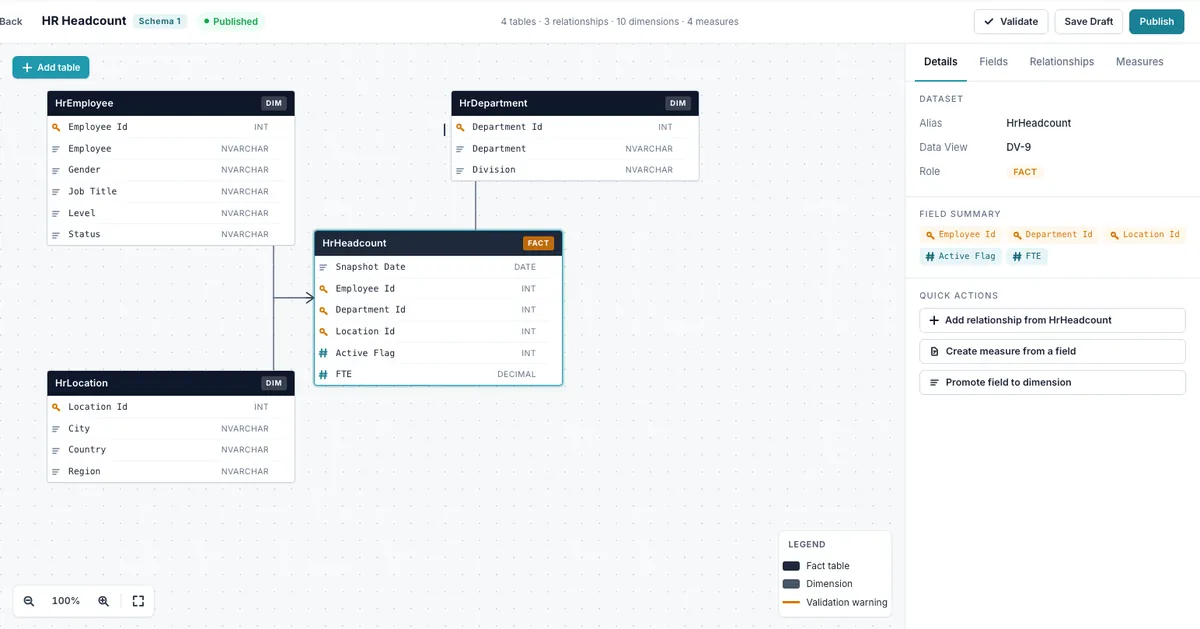
Lay out Data Views on a visual canvas, mark each as a fact or dimension table, and draw the relationships. Choose which fields become dimensions, create measures with sum, average, count and more, or write a formula. Validate the model, save a draft, and publish when it's ready.
Dashboards your team can build themselves
Drag widgets onto a grid: KPI cards, column, bar, line, area, scatter and donut charts, tables, slicers, text, images and shapes. Chart, KPI and table widgets query the Dashboard's Semantic Model. Add filters, preview the draft, and publish. Viewers always see the last published version, with the time the data was last refreshed.
OLAP: slice and pivot without writing SQL
Pick a Semantic Model or a Data View, drag fields into rows, columns and measures, and run. Switch between grid and chart. When you find something worth sharing, send it to a Dashboard as a widget.
- Department
- Year
- Headcount
| Department | 2024 | 2025 | 2026 |
|---|---|---|---|
| Finance | 58 | 61 | 64 |
| HR | 22 | 24 | 25 |
| Sales | 131 | 140 | 152 |
| Operations | 176 | 182 | 190 |
- dots78%
- FinancialOn track
- CustomerOn track
- Internal processAt risk
- Learning & growthOn track
Business Performance: a balanced scorecard on your own data
Set up perspectives, objectives and KPIs with weights and targets. Each KPI is calculated from a Data View, flagged on-track or at-risk against your thresholds, and rolled up to one organisation score with its history.
- dotsBranches
Title City Region Heliopolis Cairo Central Smouha Alexandria North Assiut Assiut South Add rowMaster Data Management for business users
Define reference tables and the relations between them, then add and edit rows from the browser. No developer ticket needed for a new lookup list.
Each person sees only the data you assign them
Group content into schemas and assign schemas per user. Data Views, Semantic Models, Dashboards, reference tables and KPIs are all filtered to the active schema. Roles control which pages each person can use.
Cloud or on-prem
Run dots on Microsoft Azure, or on servers you control. Dashboards and OLAP read only from a stored copy of your data, so your operational databases are only queried when a Data View refreshes.
Book a demo with our team
Tell us what you report on today. We'll show you how it would work in dots.